- Home
- Home Loans
- News
- Are Australia's highest-value properties also the most at-risk?
Are Australia's highest-value properties also the most at-risk?

Australia’s most expensive properties may have recorded the greatest value growth over the past year, but are also the most vulnerable to the effect of a potential housing crash, according to CoreLogic stats.
The CoreLogic Stratified Hedonic Index breaks Australia’s property market into three segments: the most affordable 25% of properties, the middle 50% and the most expensive 25%. According to the index, the annual rate of property value change across the country has started to slow over recent months.
Annual change in dwelling values across market segments, National
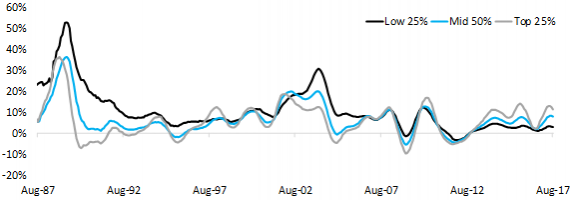
Source: CoreLogic
Looking broadly at the national market, Australia’s housing affordability crisis was found to have hit the lowest end of the market the hardest, with the most affordable 25% of the market recording price rises of 1517% over the full 30-year period of August 1987 to August 2017, while the middle 50% recorded increases of 580% and the most expensive 25% of suburbs recorded growth of 432%.
Looking at the market’s peaks and troughs over this 30-year period, while the top 25% typically recorded the highest growth spikes during boom periods, it also experienced the biggest drops in value during periods of downturn.
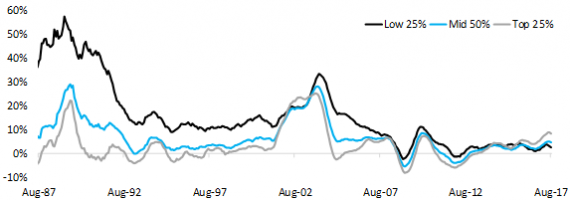
Annual change in dwelling values across market segments, Combined Capital Cities

Source: CoreLogic
Taking a closer look at Australia’s combined capital cities, the most affordable 25% of the market recorded growth of 4.6% over the past 12 months, while the middle 50% recorded a 9.3% change, and the most expensive 25% recorded a 12.2% change.
Similarly to the national stats, the most expensive 25% of properties in the capital cities appear to have experienced the greatest drops in value during market downturns.
Annual change in dwelling values across market segments, Combined Regional Markets
Source: CoreLogic
Looking at Australia’s regional markets, growth performance was much more modest in recent years compared to the cities. The most affordable 25% had previously been the strongest-performing segment, indicating demand for more affordable housing in regional areas. However, recent value changes of 2.5% in the most affordable 25% of the market, 4.6% in the mid-50%, and 8.4% in the most expensive 25% indicate increasing demand for luxury housing outside of Australia’s capital cities.
Annual change in dwelling values across market segments, individual capital cities, to Aug-17
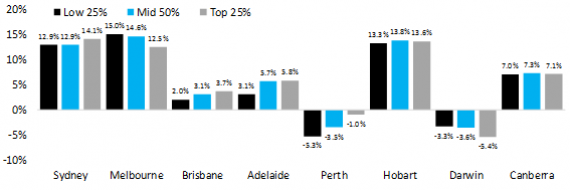
Source: CoreLogic
The last section of the Index breaks down the value growth over the past 12 months of housing in each of Australia’s individual capital cities. Of these, the cities the experienced the greatest value growth in affordable properties and the lowest growth in expensive properties were Melbourne and Darwin. All other capitals recorded the most value growth in either the mid-50% of properties or the most expensive 25%.
According to CoreLogic head of research, Cameron Kusher:
“Melbourne has a significant competitive advantage over Sydney in terms of being able to offer more affordable housing and the data seems to suggest that lower priced housing is a big driver which has led to a surge in values across the lower and also middle segments of the market.”
Mr Kusher added that if the current property market slowdown turns into a full-on decline, it remains to be seen whether the most affordable or most expensive section of the market is likely to be most affected.
“With record high levels of household debt and significant first home buyer incentives over recent years the trends in a future downturn could be different to what has been seen in the past.”
Disclaimer
This article is over two years old, last updated on September 11, 2017. While RateCity makes best efforts to update every important article regularly, the information in this piece may not be as relevant as it once was. Alternatively, please consider checking recent home loans articles.
Compare home loans in Australia
Product database updated 24 Apr, 2024
Fact Checked

Share this page
Get updates on the latest financial news and products
By continuing, you agree to the RateCity Privacy Policy, Terms of Use and Disclaimer.


